

Google Sheets Table (Finance)
Active (Unlisted) | View Recipe
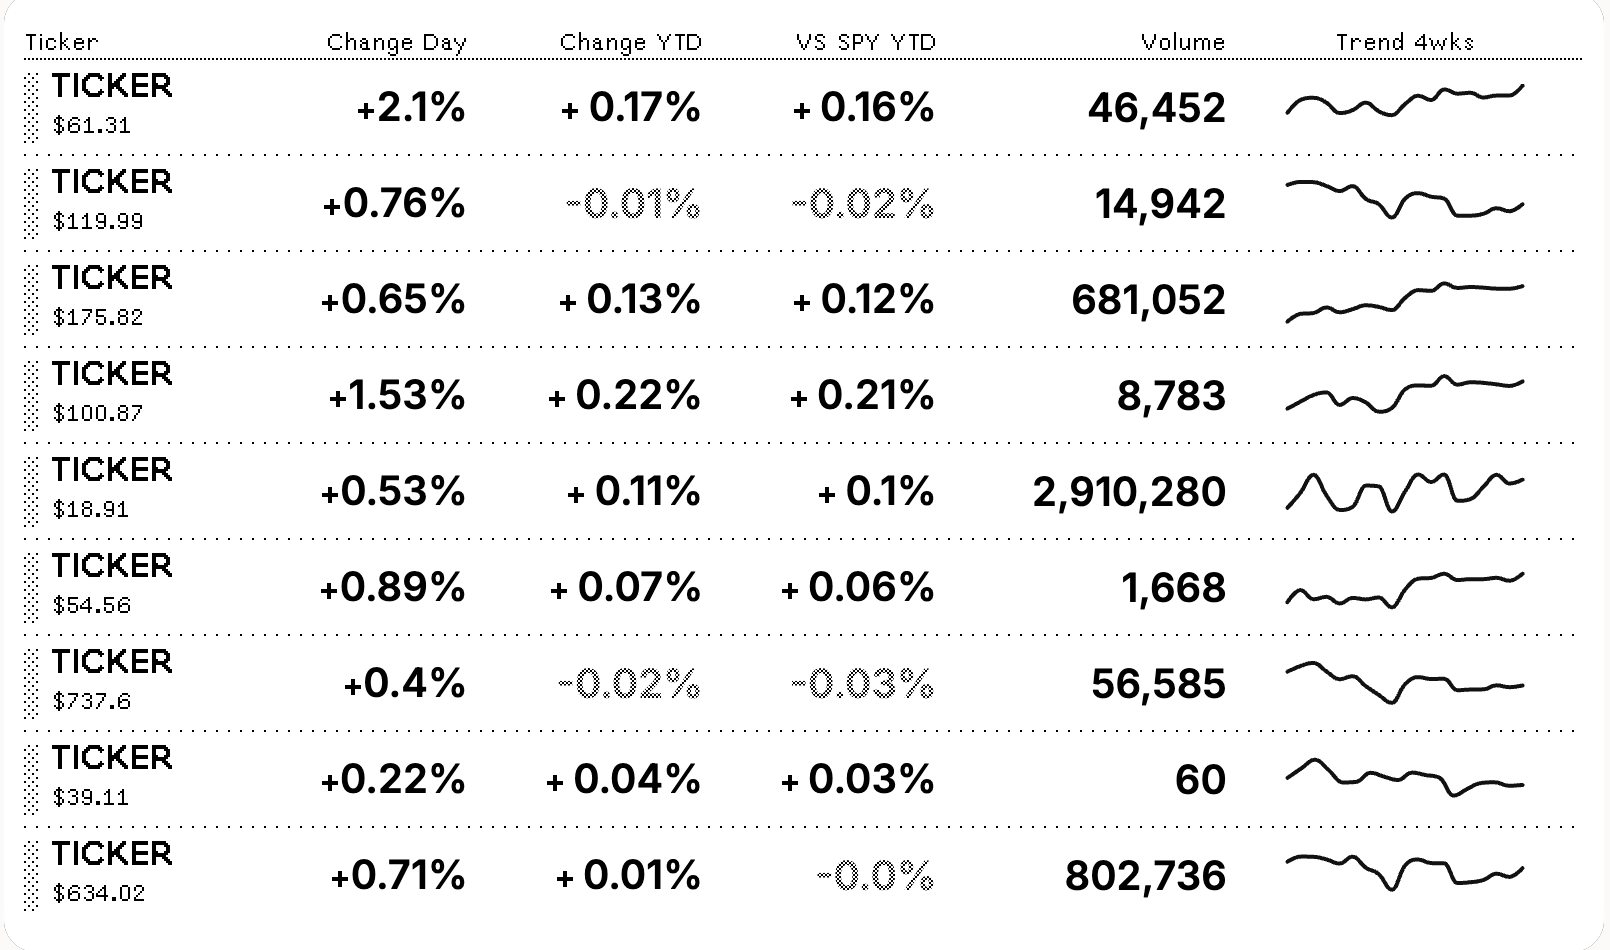
A ticker display using Google Finance from Google Sheets. Users can update the sample sheet created in their Google Drive to change the tickers with support for up to 9 on the full height screens, and 8 on the half-height screens. The app only has read/write access to this specific sheet.
Learn More
Coming soon: add custom fields and calculations. Once enabled you can add replace the seven additional columns after TICKER and CUR_PRICE - these two are required. Based on the field names the data shown behaves differently. The prefixes "CUR_", "INT_", and "PNT_" will format the values accordingly: with a "$" for currency, formatted numbers for "INT_", and a percentage sign for "PNT_". There should be no formatting in the fields in the sheet. If a column exists where the values are an array of numbers (and does not have one of the prefixes above), a sparkline graph will be generated.
US Stream Gauges
Active
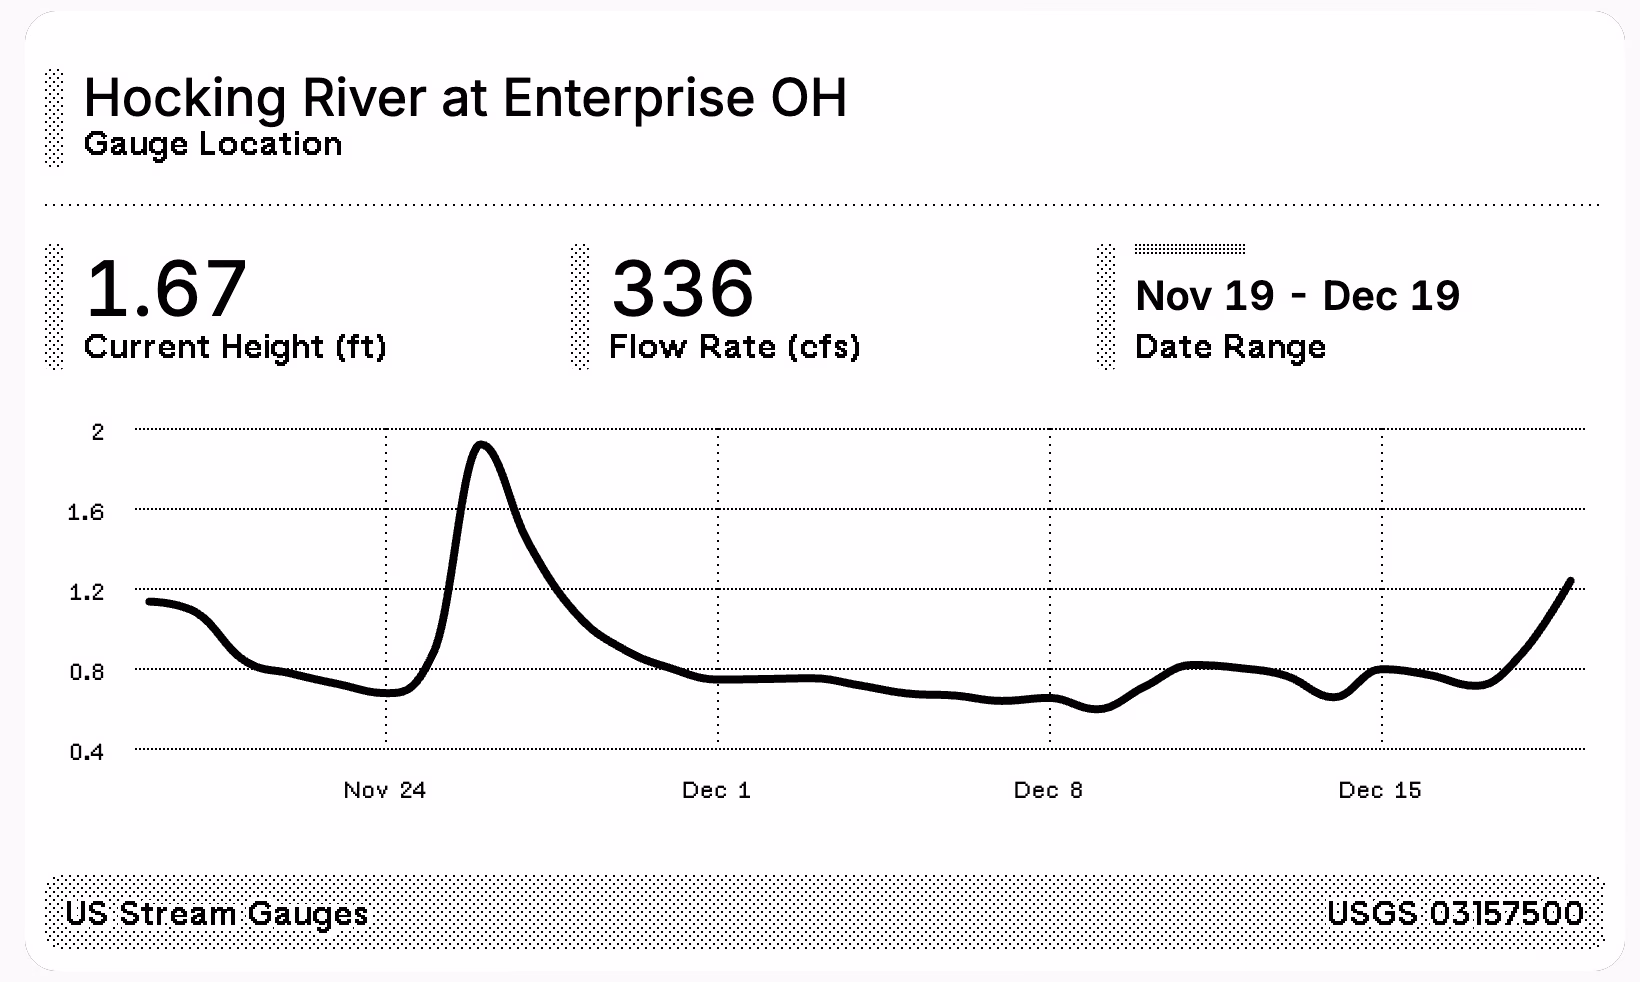
Displays stream height, 30-day height history, and flow rate for USGS stream gauages.
NOAA Tides
Active
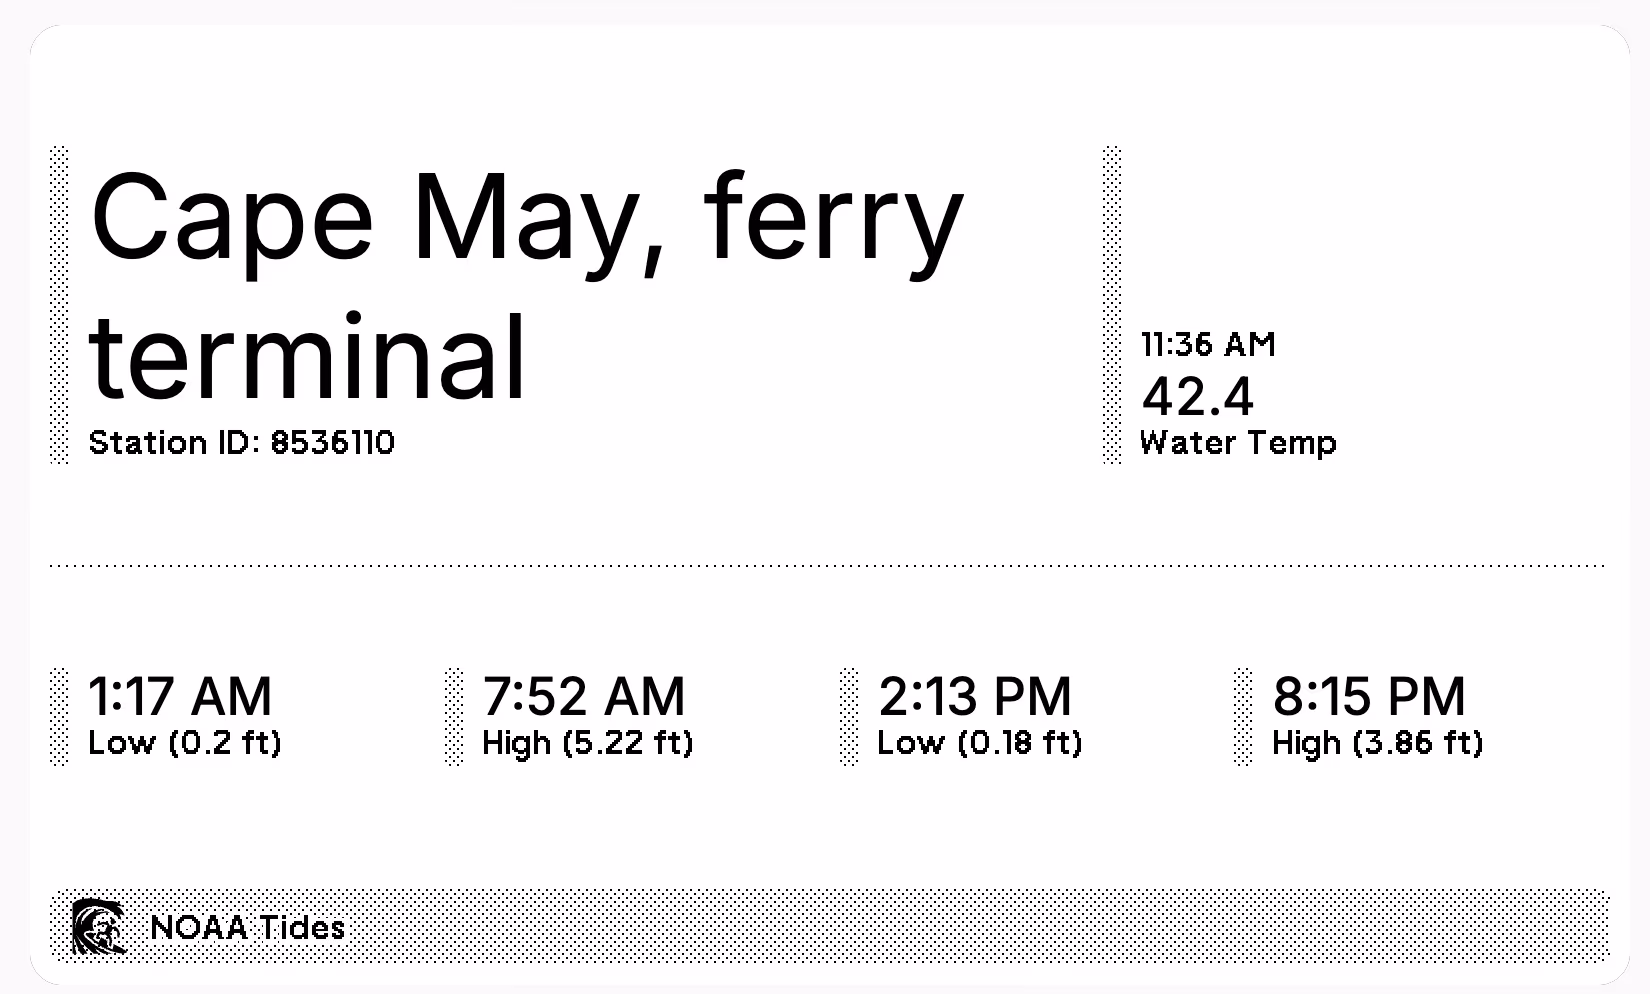
Displays low and high tide times and water temperature (where available) for NOAA tide stations.
Commodity Futures
Draft
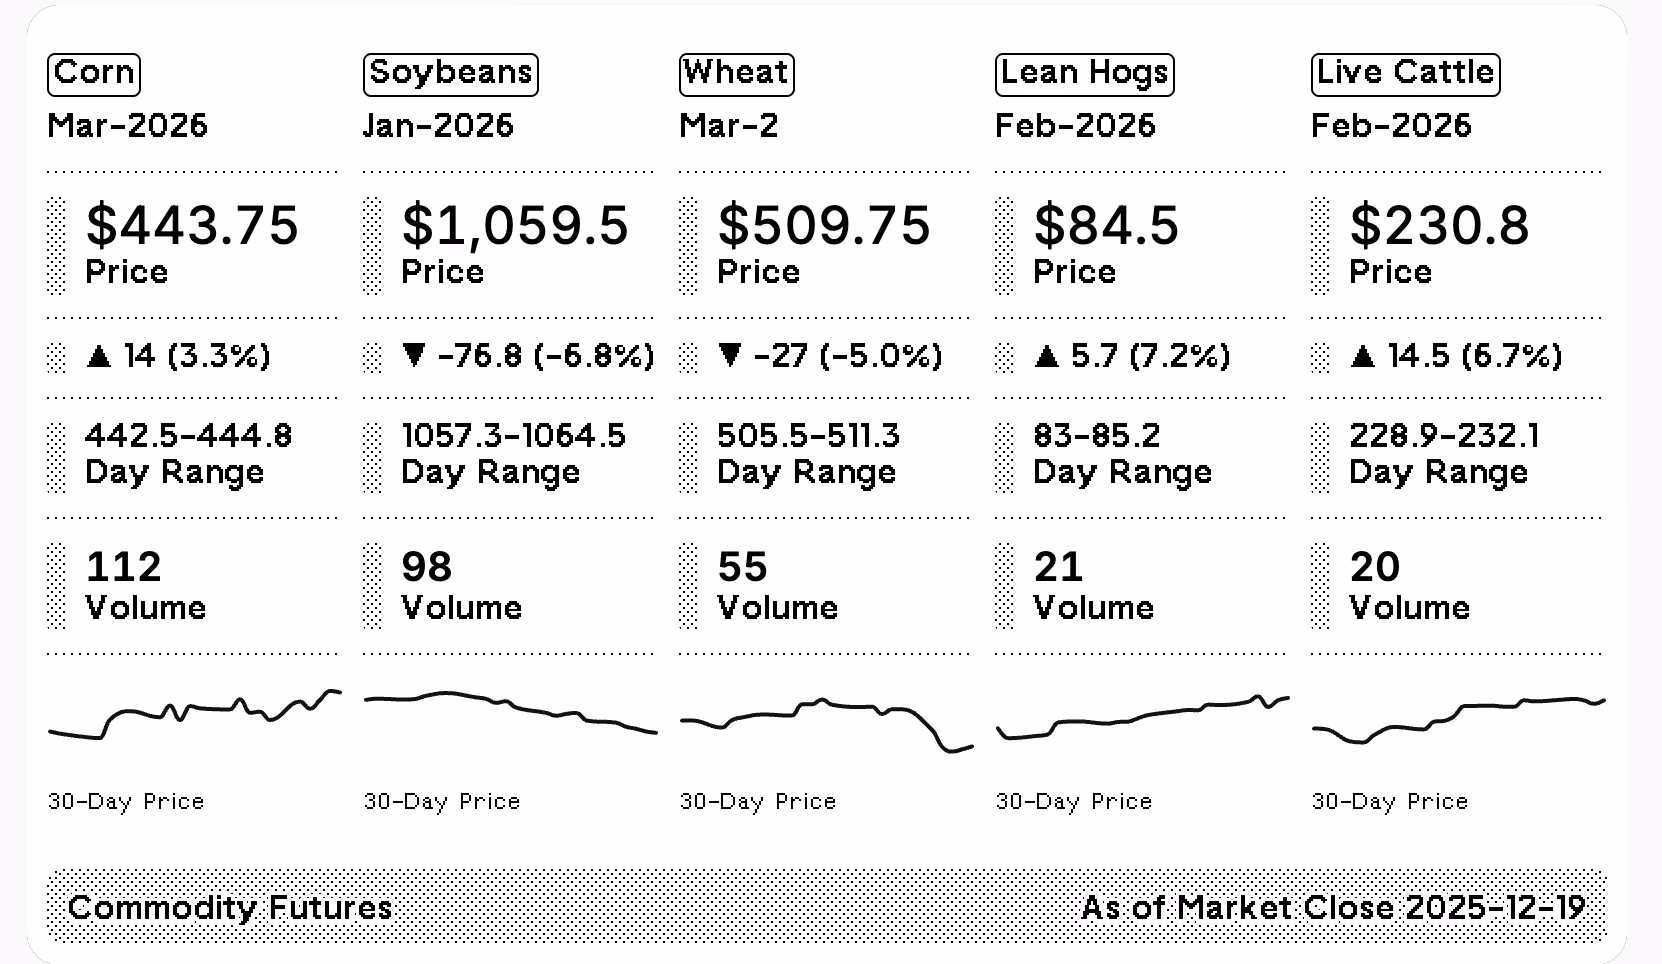
Corn, soybeans, wheat and livestock futures close market price with a 30-day sparkline chart on larger screens.


Generative Art
Active
A variety of code-generated art. Current options are boxes, circles, lines, trees, and triangles.